
 - Blog
| Conference: | SC |
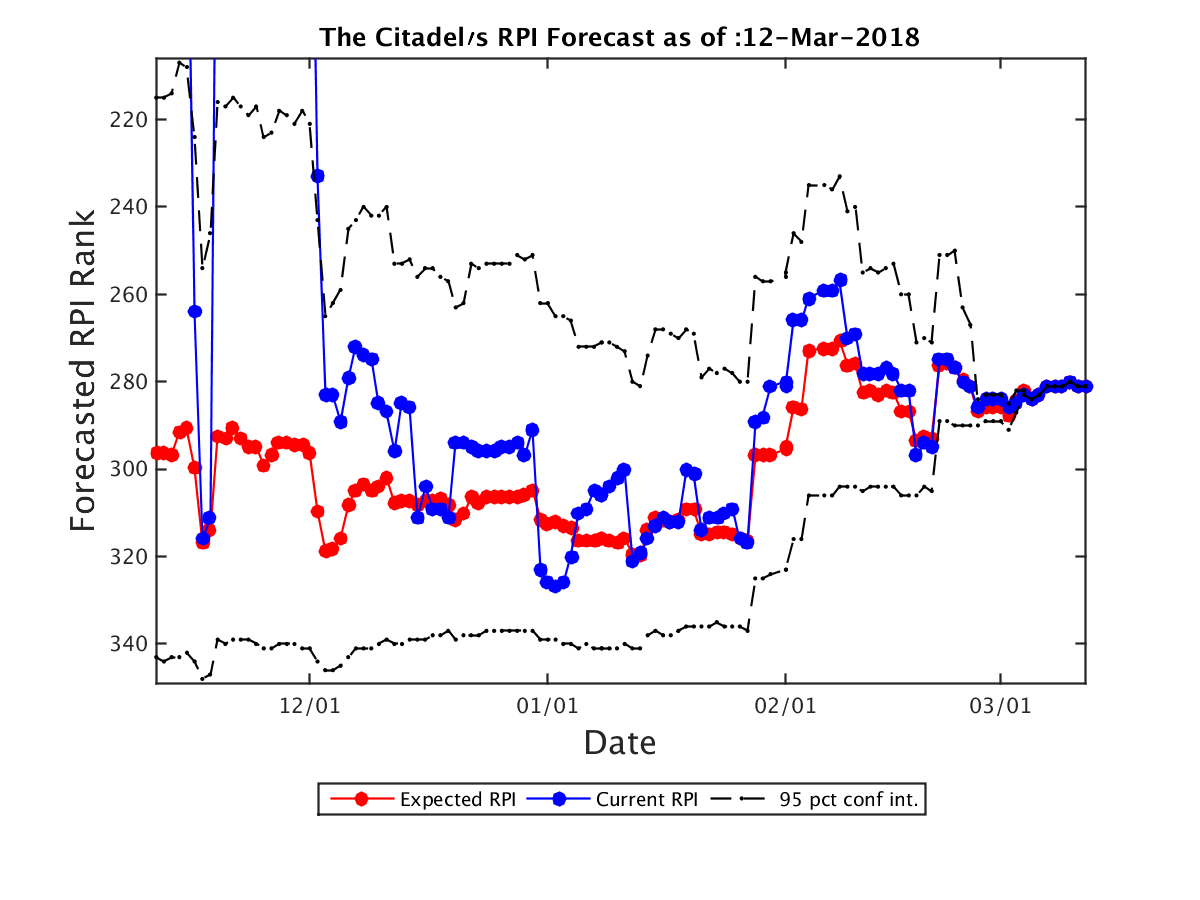
| Expected RPI: | 281.0 |
| Current RPI: | 281 |
| Expected SOS: | 198 |
| Current SOS: | 198 |
| Current Record: | 8-21 |
| Expected Record: | 8-21 |
| Current Conf Record: | 6-14 |
| Expected Conf Record: | 6-14 |
| Expected Record vs RPI 1-25: | 0-1 |
| Expected Record vs RPI 26-50: | 0-0 |
| Expected Record vs RPI 51-100: | 2-7 |
| Expected Record vs RPI 101-200: | 2-3 |
| Expected Record vs RPI 200+: | 4-10 |
| Current OOC Record: | 2-7 |
| Expected OOC Record: | 2-7 |
| Expected OOC RPI: | 265 |
| Expected OOC SOS: | 166 |
| Final Record | Expected RPI | Probability |
|---|---|---|
| 8-21 | 281.0 | 100.00% |
| Date | Opponent (Expected RPI) | Conf | Location | Score | Outcome | Prob(W) | Spread |
|---|---|---|---|---|---|---|---|
| 11-12 | Virginia Tech (61.0) | ACC | A | 132-93 | L | 0% | 0.0 |
| 11-15 | North Carolina A&T (238.0) | MEAC | A | 92-73 | L | 0% | 0.0 |
| 11-18 | High Point (273.0) | BSth | A | 77-79 | W | 100% | 0.0 |
| 11-24 | Florida St. (54.0) | ACC | A | 113-78 | L | 0% | 0.0 |
| 12-1 | Marist (324.0) | MAAC | H | 91-100 | L | 0% | 0.0 |
| 12-2 | UMBC (111.0) | AE | H | 72-98 | L | 0% | 0.0 |
| 12-5 | James Madison (272.0) | CAA | H | 84-82 | W | 100% | 0.0 |
| 12-14 | Campbell (267.0) | BSth | A | 87-77 | L | 0% | 0.0 |
| 12-19 | Ohio St. (20.0) | B10 | A | 94-65 | L | 0% | 0.0 |
| 12-30 | Western Carolina (215.0) | SC | H | 79-81 | L | 0% | 0.0 |
| 1-4 | Furman (97.0) | SC | A | 107-67 | L | 0% | 0.0 |
| 1-6 | Wofford (129.0) | SC | A | 109-92 | L | 0% | 0.0 |
| 1-11 | Samford (296.0) | SC | H | 91-107 | L | 0% | 0.0 |
| 1-13 | Chattanooga (304.0) | SC | H | 110-101 | W | 100% | 0.0 |
| 1-18 | UNC Greensboro (65.0) | SC | A | 72-58 | L | 0% | 0.0 |
| 1-20 | VMI (313.0) | SC | A | 88-81 | L | 0% | 0.0 |
| 1-27 | Mercer (174.0) | SC | A | 74-76 | W | 100% | 0.0 |
| 1-29 | East Tennessee St. (93.0) | SC | H | 71-73 | L | 0% | 0.0 |
| 2-1 | Wofford (129.0) | SC | H | 80-78 | W | 100% | 0.0 |
| 2-3 | Furman (97.0) | SC | H | 100-92 | W | 100% | 0.0 |
| 2-8 | Chattanooga (304.0) | SC | A | 85-82 | L | 0% | 0.0 |
| 2-10 | Samford (296.0) | SC | A | 116-103 | L | 0% | 0.0 |
| 2-15 | UNC Greensboro (65.0) | SC | H | 66-82 | L | 0% | 0.0 |
| 2-17 | VMI (313.0) | SC | H | 71-75 | L | 0% | 0.0 |
| 2-20 | East Tennessee St. (93.0) | SC | A | 82-84 | W | 100% | 0.0 |
| 2-23 | Mercer (174.0) | SC | H | 70-83 | L | 0% | 0.0 |
| 2-25 | Western Carolina (215.0) | SC | A | 92-75 | L | 0% | 0.0 |
| 3-2 | VMI (313.0) | SC | N | 78-70 | W | 100% | 0.0 |
| 3-3 | UNC Greensboro (65.0) | SC | N | 72-58 | L | 0% | 0.0 |
| Team | Conf | Curr Wgt | Fut Wgt | Curr W/L | Exp W/L | Curr Impact | Exp Impact |
|---|---|---|---|---|---|---|---|
| The Citadel | SC | 26.57 | 26.57 | 28.15 | 28.15 | -11.61 | -11.61 |
| UNC Greensboro | SC | 6.26 | 6.26 | 75.00 | 75.00 | 3.13 | 3.13 |
| VMI | SC | 6.13 | 6.13 | 20.00 | 20.00 | -3.68 | -3.68 |
| East Tennessee St. | SC | 4.68 | 4.68 | 73.33 | 73.33 | 2.18 | 2.18 |
| Wofford | SC | 4.65 | 4.65 | 60.71 | 60.71 | 1.00 | 1.00 |
| Chattanooga | SC | 4.59 | 4.59 | 24.14 | 24.14 | -2.37 | -2.37 |
| Furman | SC | 4.59 | 4.59 | 68.97 | 68.97 | 1.74 | 1.74 |
| Western Carolina | SC | 4.56 | 4.56 | 32.14 | 32.14 | -1.63 | -1.63 |
| Mercer | SC | 4.53 | 4.53 | 53.57 | 53.57 | 0.32 | 0.32 |
| Samford | SC | 4.53 | 4.53 | 21.43 | 21.43 | -2.59 | -2.59 |
| High Point | BSth | 1.90 | 1.90 | 42.31 | 42.31 | -0.29 | -0.29 |
| Campbell | BSth | 1.79 | 1.79 | 44.44 | 44.44 | -0.20 | -0.20 |
| Virginia Tech | ACC | 1.78 | 1.78 | 64.52 | 64.52 | 0.52 | 0.52 |
| Florida St. | ACC | 1.75 | 1.75 | 63.33 | 63.33 | 0.47 | 0.47 |
| North Carolina A&T | MEAC | 1.75 | 1.75 | 54.84 | 54.84 | 0.17 | 0.17 |
| James Madison | CAA | 1.72 | 1.72 | 30.00 | 30.00 | -0.69 | -0.69 |
| Marist | MAAC | 1.72 | 1.72 | 16.67 | 16.67 | -1.15 | -1.15 |
| Ohio St. | B10 | 1.72 | 1.72 | 74.19 | 74.19 | 0.83 | 0.83 |
| UMBC | AE | 1.72 | 1.72 | 66.67 | 66.67 | 0.57 | 0.57 |
| UNC Asheville | BSth | 0.38 | 0.38 | 61.29 | 61.29 | 0.09 | 0.09 |
| Presbyterian | BSth | 0.36 | 0.36 | 27.59 | 27.59 | -0.16 | -0.16 |
| Longwood | BSth | 0.33 | 0.33 | 13.33 | 13.33 | -0.24 | -0.24 |
| Radford | BSth | 0.33 | 0.33 | 62.50 | 62.50 | 0.08 | 0.08 |
| Liberty | BSth | 0.30 | 0.30 | 54.84 | 54.84 | 0.03 | 0.03 |
| Clemson | ACC | 0.25 | 0.25 | 71.88 | 71.88 | 0.11 | 0.11 |
| Charleston Southern | BSth | 0.25 | 0.25 | 42.86 | 42.86 | -0.04 | -0.04 |
| North Carolina St. | ACC | 0.23 | 0.23 | 65.62 | 65.62 | 0.07 | 0.07 |
| UNC Wilmington | CAA | 0.23 | 0.23 | 30.00 | 30.00 | -0.09 | -0.09 |
| North Carolina | ACC | 0.20 | 0.20 | 71.43 | 71.43 | 0.08 | 0.08 |
| Elon | CAA | 0.19 | 0.19 | 40.00 | 40.00 | -0.04 | -0.04 |
| Winthrop | BSth | 0.18 | 0.18 | 57.14 | 57.14 | 0.03 | 0.03 |
| Jacksonville St. | OVC | 0.17 | 0.17 | 62.50 | 62.50 | 0.04 | 0.04 |
| Virginia | ACC | 0.17 | 0.17 | 93.94 | 93.94 | 0.15 | 0.15 |
| Northern Kentucky | Horz | 0.16 | 0.16 | 68.97 | 68.97 | 0.06 | 0.06 |
| Delaware St. | MEAC | 0.16 | 0.16 | 6.67 | 6.67 | -0.14 | -0.14 |
| College of Charleston | CAA | 0.15 | 0.15 | 77.42 | 77.42 | 0.08 | 0.08 |
| Tennessee | SEC | 0.15 | 0.15 | 75.76 | 75.76 | 0.07 | 0.07 |
| Kennesaw St. | ASun | 0.14 | 0.14 | 28.57 | 28.57 | -0.06 | -0.06 |
| Drexel | CAA | 0.14 | 0.14 | 37.50 | 37.50 | -0.04 | -0.04 |
| Delaware | CAA | 0.14 | 0.14 | 38.71 | 38.71 | -0.03 | -0.03 |
| Northeastern | CAA | 0.14 | 0.14 | 68.75 | 68.75 | 0.05 | 0.05 |
| Wake Forest | ACC | 0.14 | 0.14 | 35.48 | 35.48 | -0.04 | -0.04 |
| Duke | ACC | 0.14 | 0.14 | 78.79 | 78.79 | 0.08 | 0.08 |
| Louisville | ACC | 0.14 | 0.14 | 60.61 | 60.61 | 0.03 | 0.03 |
| Gardner Webb | BSth | 0.13 | 0.13 | 37.93 | 37.93 | -0.03 | -0.03 |
| Duquesne | A10 | 0.12 | 0.12 | 50.00 | 50.00 | 0.00 | 0.00 |
| Charlotte | CUSA | 0.12 | 0.12 | 17.86 | 17.86 | -0.07 | -0.07 |
| Alabama A&M | SWAC | 0.11 | 0.11 | 9.68 | 9.68 | -0.09 | -0.09 |
| Memphis | Amer | 0.11 | 0.11 | 61.76 | 61.76 | 0.03 | 0.03 |
| William & Mary | CAA | 0.11 | 0.11 | 58.62 | 58.62 | 0.02 | 0.02 |
| Appalachian St. | SB | 0.11 | 0.11 | 41.94 | 41.94 | -0.02 | -0.02 |
| Georgia Tech | ACC | 0.11 | 0.11 | 40.62 | 40.62 | -0.02 | -0.02 |
| Penn St. | B10 | 0.11 | 0.11 | 61.76 | 61.76 | 0.03 | 0.03 |
| New Hampshire | AE | 0.11 | 0.11 | 27.59 | 27.59 | -0.05 | -0.05 |
| Tennessee Tech | OVC | 0.11 | 0.11 | 54.84 | 54.84 | 0.01 | 0.01 |
| UMass Lowell | AE | 0.11 | 0.11 | 37.93 | 37.93 | -0.03 | -0.03 |
| Miami FL | ACC | 0.11 | 0.11 | 70.97 | 70.97 | 0.05 | 0.05 |
| American | Pat | 0.09 | 0.09 | 20.00 | 20.00 | -0.06 | -0.06 |
| Davidson | A10 | 0.09 | 0.09 | 65.62 | 65.62 | 0.03 | 0.03 |
| VCU | A10 | 0.09 | 0.09 | 54.55 | 54.55 | 0.01 | 0.01 |
| Pittsburgh | ACC | 0.09 | 0.09 | 25.00 | 25.00 | -0.04 | -0.04 |
| Florida A&M | MEAC | 0.08 | 0.08 | 24.24 | 24.24 | -0.04 | -0.04 |
| Minnesota | B10 | 0.08 | 0.08 | 46.88 | 46.88 | -0.01 | -0.01 |
| Army | Pat | 0.08 | 0.08 | 41.38 | 41.38 | -0.01 | -0.01 |
| Fairfield | MAAC | 0.08 | 0.08 | 51.52 | 51.52 | 0.00 | 0.00 |
| Hartford | AE | 0.08 | 0.08 | 58.06 | 58.06 | 0.01 | 0.01 |
| Towson | CAA | 0.08 | 0.08 | 53.33 | 53.33 | 0.01 | 0.01 |
| Vermont | AE | 0.08 | 0.08 | 78.79 | 78.79 | 0.05 | 0.05 |
| Boston College | ACC | 0.08 | 0.08 | 55.88 | 55.88 | 0.01 | 0.01 |
| Butler | BE | 0.08 | 0.08 | 60.61 | 60.61 | 0.02 | 0.02 |
| South Carolina St. | MEAC | 0.08 | 0.08 | 26.67 | 26.67 | -0.04 | -0.04 |
| Fordham | A10 | 0.08 | 0.08 | 29.03 | 29.03 | -0.03 | -0.03 |
| Notre Dame | ACC | 0.08 | 0.08 | 57.58 | 57.58 | 0.01 | 0.01 |
| Rutgers | B10 | 0.08 | 0.08 | 42.42 | 42.42 | -0.01 | -0.01 |
| Detroit | Horz | 0.08 | 0.08 | 20.00 | 20.00 | -0.05 | -0.05 |
| Iowa | B10 | 0.08 | 0.08 | 42.42 | 42.42 | -0.01 | -0.01 |
| Kentucky | SEC | 0.08 | 0.08 | 70.59 | 70.59 | 0.03 | 0.03 |
| Maryland Eastern Shore | MEAC | 0.08 | 0.08 | 16.67 | 16.67 | -0.05 | -0.05 |
| Savannah St. | MEAC | 0.08 | 0.08 | 43.33 | 43.33 | -0.01 | -0.01 |
| Stetson | ASun | 0.06 | 0.06 | 28.57 | 28.57 | -0.03 | -0.03 |
| East Carolina | Amer | 0.06 | 0.06 | 33.33 | 33.33 | -0.02 | -0.02 |
| Saint Louis | A10 | 0.06 | 0.06 | 50.00 | 50.00 | 0.00 | 0.00 |
| Alabama | SEC | 0.06 | 0.06 | 55.88 | 55.88 | 0.01 | 0.01 |
| Arkansas | SEC | 0.06 | 0.06 | 67.65 | 67.65 | 0.02 | 0.02 |
| California | P12 | 0.06 | 0.06 | 25.81 | 25.81 | -0.03 | -0.03 |
| Cincinnati | Amer | 0.06 | 0.06 | 88.24 | 88.24 | 0.04 | 0.04 |
| Coastal Carolina | SB | 0.06 | 0.06 | 37.93 | 37.93 | -0.01 | -0.01 |
| Colorado | P12 | 0.06 | 0.06 | 53.12 | 53.12 | 0.00 | 0.00 |
| Harvard | Ivy | 0.06 | 0.06 | 56.67 | 56.67 | 0.01 | 0.01 |
| Jackson St. | SWAC | 0.06 | 0.06 | 33.33 | 33.33 | -0.02 | -0.02 |
| La Salle | A10 | 0.06 | 0.06 | 40.62 | 40.62 | -0.01 | -0.01 |
| Loyola Chicago | MVC | 0.06 | 0.06 | 84.38 | 84.38 | 0.04 | 0.04 |
| LSU | SEC | 0.06 | 0.06 | 54.84 | 54.84 | 0.01 | 0.01 |
| Massachusetts | A10 | 0.06 | 0.06 | 39.39 | 39.39 | -0.01 | -0.01 |
| Mississippi Valley St. | SWAC | 0.06 | 0.06 | 12.50 | 12.50 | -0.04 | -0.04 |
| North Florida | ASun | 0.06 | 0.06 | 36.67 | 36.67 | -0.02 | -0.02 |
| South Carolina | SEC | 0.06 | 0.06 | 50.00 | 50.00 | 0.00 | 0.00 |
| Southeastern Louisiana | Slnd | 0.06 | 0.06 | 63.33 | 63.33 | 0.02 | 0.02 |
| Texas Tech | B12 | 0.06 | 0.06 | 72.73 | 72.73 | 0.03 | 0.03 |
| UCF | Amer | 0.06 | 0.06 | 59.38 | 59.38 | 0.01 | 0.01 |
| UT Arlington | SB | 0.06 | 0.06 | 60.61 | 60.61 | 0.01 | 0.01 |
| Valparaiso | MVC | 0.06 | 0.06 | 43.33 | 43.33 | -0.01 | -0.01 |
| Akron | MAC | 0.06 | 0.06 | 41.94 | 41.94 | -0.01 | -0.01 |
| Alabama St. | SWAC | 0.06 | 0.06 | 25.81 | 25.81 | -0.03 | -0.03 |
| Albany | AE | 0.06 | 0.06 | 67.74 | 67.74 | 0.02 | 0.02 |
| Binghamton | AE | 0.06 | 0.06 | 31.03 | 31.03 | -0.02 | -0.02 |
| Canisius | MAAC | 0.06 | 0.06 | 65.62 | 65.62 | 0.02 | 0.02 |
| Colgate | Pat | 0.06 | 0.06 | 58.06 | 58.06 | 0.01 | 0.01 |
| Florida | SEC | 0.06 | 0.06 | 62.50 | 62.50 | 0.01 | 0.01 |
| Georgia St. | SB | 0.06 | 0.06 | 68.75 | 68.75 | 0.02 | 0.02 |
| Hofstra | CAA | 0.06 | 0.06 | 60.00 | 60.00 | 0.01 | 0.01 |
| Maine | AE | 0.06 | 0.06 | 13.33 | 13.33 | -0.04 | -0.04 |
| Manhattan | MAAC | 0.06 | 0.06 | 45.16 | 45.16 | -0.01 | -0.01 |
| Marshall | CUSA | 0.06 | 0.06 | 69.70 | 69.70 | 0.02 | 0.02 |
| Niagara | MAAC | 0.06 | 0.06 | 59.38 | 59.38 | 0.01 | 0.01 |
| Quinnipiac | MAAC | 0.06 | 0.06 | 36.36 | 36.36 | -0.02 | -0.02 |
| Rider | MAAC | 0.06 | 0.06 | 70.97 | 70.97 | 0.02 | 0.02 |
| Saint Peter's | MAAC | 0.06 | 0.06 | 43.75 | 43.75 | -0.01 | -0.01 |
| Siena | MAAC | 0.06 | 0.06 | 25.00 | 25.00 | -0.03 | -0.03 |
| Stony Brook | AE | 0.06 | 0.06 | 38.71 | 38.71 | -0.01 | -0.01 |
| Tennessee Martin | OVC | 0.06 | 0.06 | 27.59 | 27.59 | -0.02 | -0.02 |
| UAB | CUSA | 0.06 | 0.06 | 58.06 | 58.06 | 0.01 | 0.01 |
| Wyoming | MWC | 0.06 | 0.06 | 59.38 | 59.38 | 0.01 | 0.01 |
| Coppin St. | MEAC | 0.05 | 0.05 | 15.62 | 15.62 | -0.04 | -0.04 |
| Maryland | B10 | 0.05 | 0.05 | 58.06 | 58.06 | 0.01 | 0.01 |
| Nebraska | B10 | 0.05 | 0.05 | 68.75 | 68.75 | 0.02 | 0.02 |
| Syracuse | ACC | 0.05 | 0.05 | 60.61 | 60.61 | 0.01 | 0.01 |
| Fort Wayne | Sum | 0.05 | 0.05 | 50.00 | 50.00 | 0.00 | 0.00 |
| Georgia Southern | SB | 0.05 | 0.05 | 61.29 | 61.29 | 0.01 | 0.01 |
| Hampton | MEAC | 0.05 | 0.05 | 51.61 | 51.61 | 0.00 | 0.00 |
| Howard | MEAC | 0.05 | 0.05 | 25.81 | 25.81 | -0.03 | -0.03 |
| Indiana | B10 | 0.05 | 0.05 | 51.61 | 51.61 | 0.00 | 0.00 |
| Michigan | B10 | 0.05 | 0.05 | 79.41 | 79.41 | 0.03 | 0.03 |
| Norfolk St. | MEAC | 0.05 | 0.05 | 43.33 | 43.33 | -0.01 | -0.01 |
| North Carolina Central | MEAC | 0.05 | 0.05 | 51.61 | 51.61 | 0.00 | 0.00 |
| Troy | SB | 0.05 | 0.05 | 45.16 | 45.16 | -0.01 | -0.01 |
| Xavier | BE | 0.05 | 0.05 | 84.85 | 84.85 | 0.04 | 0.04 |
| Abilene Christian | Slnd | 0.03 | 0.03 | 44.44 | 44.44 | -0.00 | -0.00 |
| Bowling Green | MAC | 0.03 | 0.03 | 46.67 | 46.67 | -0.00 | -0.00 |
| USC Upstate | ASun | 0.03 | 0.03 | 10.71 | 10.71 | -0.02 | -0.02 |
| Arizona | P12 | 0.03 | 0.03 | 79.41 | 79.41 | 0.02 | 0.02 |
| Brown | Ivy | 0.03 | 0.03 | 38.46 | 38.46 | -0.01 | -0.01 |
| Chicago St. | WAC | 0.03 | 0.03 | 3.33 | 3.33 | -0.03 | -0.03 |
| Colorado St. | MWC | 0.03 | 0.03 | 32.26 | 32.26 | -0.01 | -0.01 |
| FIU | CUSA | 0.03 | 0.03 | 37.93 | 37.93 | -0.01 | -0.01 |
| George Mason | A10 | 0.03 | 0.03 | 48.48 | 48.48 | -0.00 | -0.00 |
| George Washington | A10 | 0.03 | 0.03 | 45.45 | 45.45 | -0.00 | -0.00 |
| Iona | MAAC | 0.03 | 0.03 | 60.61 | 60.61 | 0.01 | 0.01 |
| Lehigh | Pat | 0.03 | 0.03 | 51.72 | 51.72 | 0.00 | 0.00 |
| Loyola MD | Pat | 0.03 | 0.03 | 26.67 | 26.67 | -0.01 | -0.01 |
| Monmouth | MAAC | 0.03 | 0.03 | 35.48 | 35.48 | -0.01 | -0.01 |
| Murray St. | OVC | 0.03 | 0.03 | 82.76 | 82.76 | 0.02 | 0.02 |
| Nicholls St. | Slnd | 0.03 | 0.03 | 60.71 | 60.71 | 0.01 | 0.01 |
| Oklahoma St. | B12 | 0.03 | 0.03 | 57.58 | 57.58 | 0.00 | 0.00 |
| Old Dominion | CUSA | 0.03 | 0.03 | 78.12 | 78.12 | 0.02 | 0.02 |
| Oregon St. | P12 | 0.03 | 0.03 | 50.00 | 50.00 | 0.00 | 0.00 |
| Richmond | A10 | 0.03 | 0.03 | 37.50 | 37.50 | -0.01 | -0.01 |
| SMU | Amer | 0.03 | 0.03 | 51.52 | 51.52 | 0.00 | 0.00 |
| Southern Miss | CUSA | 0.03 | 0.03 | 40.00 | 40.00 | -0.01 | -0.01 |
| Tulane | Amer | 0.03 | 0.03 | 45.16 | 45.16 | -0.00 | -0.00 |
| UTSA | CUSA | 0.03 | 0.03 | 53.33 | 53.33 | 0.00 | 0.00 |
| Weber St. | BSky | 0.03 | 0.03 | 60.71 | 60.71 | 0.01 | 0.01 |
| West Virginia | B12 | 0.03 | 0.03 | 70.59 | 70.59 | 0.01 | 0.01 |
| Bethune Cookman | MEAC | 0.03 | 0.03 | 53.33 | 53.33 | 0.00 | 0.00 |
| Central Connecticut | NEC | 0.03 | 0.03 | 43.75 | 43.75 | -0.00 | -0.00 |
| Georgetown | BE | 0.03 | 0.03 | 50.00 | 50.00 | 0.00 | 0.00 |
| Gonzaga | WCC | 0.03 | 0.03 | 88.24 | 88.24 | 0.02 | 0.02 |
| Houston Baptist | Slnd | 0.03 | 0.03 | 10.71 | 10.71 | -0.02 | -0.02 |
| Illinois | B10 | 0.03 | 0.03 | 41.94 | 41.94 | -0.00 | -0.00 |
| Jacksonville | ASun | 0.03 | 0.03 | 37.93 | 37.93 | -0.01 | -0.01 |
| Lamar | Slnd | 0.03 | 0.03 | 53.57 | 53.57 | 0.00 | 0.00 |
| Miami OH | MAC | 0.03 | 0.03 | 45.16 | 45.16 | -0.00 | -0.00 |
| Michigan St. | B10 | 0.03 | 0.03 | 87.88 | 87.88 | 0.02 | 0.02 |
| Mississippi | SEC | 0.03 | 0.03 | 37.50 | 37.50 | -0.01 | -0.01 |
| Morehead St. | OVC | 0.03 | 0.03 | 22.22 | 22.22 | -0.01 | -0.01 |
| Morgan St. | MEAC | 0.03 | 0.03 | 36.67 | 36.67 | -0.01 | -0.01 |
| Northwestern | B10 | 0.03 | 0.03 | 45.16 | 45.16 | -0.00 | -0.00 |
| Purdue | B10 | 0.03 | 0.03 | 82.35 | 82.35 | 0.02 | 0.02 |
| Robert Morris | NEC | 0.03 | 0.03 | 48.48 | 48.48 | -0.00 | -0.00 |
| Southern Illinois | MVC | 0.03 | 0.03 | 59.38 | 59.38 | 0.01 | 0.01 |
| Stanford | P12 | 0.03 | 0.03 | 54.55 | 54.55 | 0.00 | 0.00 |
| Tennessee St. | OVC | 0.03 | 0.03 | 46.43 | 46.43 | -0.00 | -0.00 |
| Texas Southern | SWAC | 0.03 | 0.03 | 44.12 | 44.12 | -0.00 | -0.00 |
| Washington | P12 | 0.03 | 0.03 | 62.50 | 62.50 | 0.01 | 0.01 |
| Wisconsin | B10 | 0.03 | 0.03 | 45.45 | 45.45 | -0.00 | -0.00 |